
Improvement graphs for mental health record information are valuable tools used by professionals to enhance the quality of mental health therapy services provided to individuals. These graphs track and analyze various aspects of a person’s mental health progress over time, allowing therapists and clinicians to gain insights, make informed decisions, and tailor treatment plans accordingly.
The primary purpose of improvement graphs is to visualize and measure changes in a person’s mental health symptoms, functioning, and overall well-being. By plotting relevant data points on a graph, professionals can observe trends, patterns, and areas of improvement or decline. This information aids in the assessment of treatment effectiveness and helps professionals identify the most appropriate interventions for each individual.
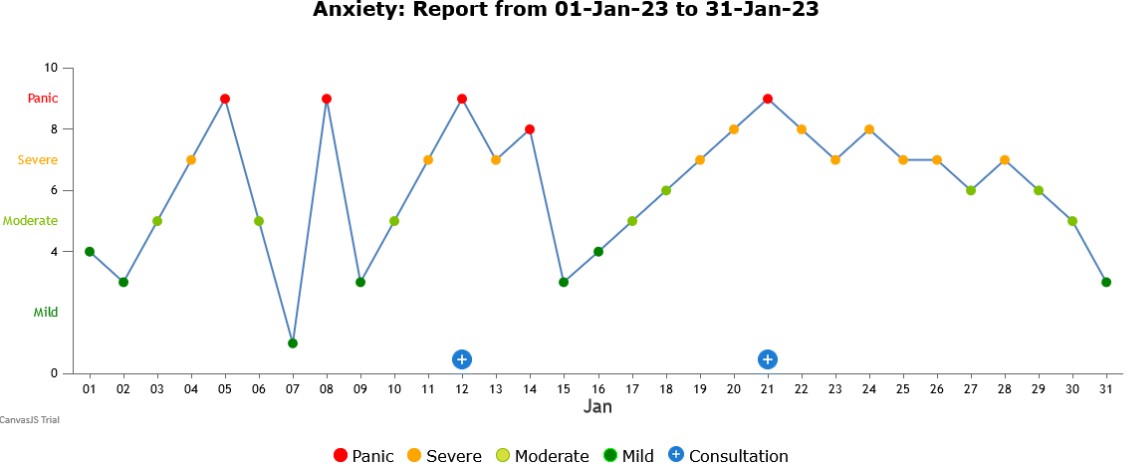
Symptom Monitoring: Improvement graphs often focus on tracking specific symptoms or symptom clusters that are relevant to the individual’s diagnosis or concerns. These symptoms could include anxiety levels, depressive episodes, sleep patterns, mood fluctuations, or any other relevant indicators. By consistently recording and graphing these symptoms, therapists can assess the severity, frequency, and duration of symptoms over time.
Functional Assessment: In addition to symptom monitoring, improvement graphs may also include measurements of functional abilities and performance in daily life. This could involve tracking areas such as social interactions, occupational functioning, academic performance, or self-care skills. Graphing these data points helps professionals understand how a person’s mental health impacts their overall functioning and identify areas that require attention.
Treatment Interventions: Improvement graphs are closely tied to the treatment interventions provided. Therapists can document the specific interventions utilized, such as therapy modalities, medication changes, lifestyle modifications, or other strategies implemented during the course of treatment. By aligning these interventions with the graphed data, professionals can evaluate the impact of various approaches and make informed adjustments to optimize therapy outcomes.
Progress Assessment: Improvement graphs allow professionals to assess the progress made by individuals over time. By comparing current data points with past records, therapists can identify trends, improvements, or setbacks. This analysis enables professionals to gauge the effectiveness of the therapy and determine whether adjustments need to be made to the treatment plan.
Collaborative Decision-Making: Improvement graphs facilitate collaboration between professionals and individuals receiving mental health therapy. By visualizing progress, professionals can engage in meaningful discussions with their clients, empowering them to actively participate in their own treatment. Individuals can gain a clearer understanding of their mental health journey, set realistic goals, and work together with their therapists to make informed decisions about the next steps in their treatment.